STI Breadth
Introduction
Breadth Line chart is calculated based on the Breadth Line Value (as known as Advance-Decline-Line). Breadth Index is used to measure internal strength of the market. An index may be rising but lacked of internal strength therefore it might gives investor wrong information on the market.How to Use
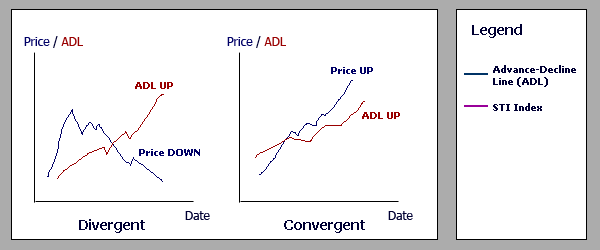
On days when the number of advancing stocks exceeds the number of declining stocks, the breadth line will rise. On days when more declining stocks than advancing stocks, the line will fall.
When comparing with the price of the stock, a negative divergence trend might suggests signal of weak market. For an example, in some cases of end of bull market, only some large market cap stocks continue to rise. The index will rise due to these stock hence will gives investors an implication that market is still strong. However, this is wrong because the market is not boardly advancing and the risk level increases as divergence continues.