30 May 2007

What makes it so Important?
USD$1 = xxx.xxx YEN shows how much Yen can be converted from USD$1. When Yen is relatively stronger than USD the situation is not good for Yen Carry Traders.
Here is the simple analogy to understand basic of Yen Carry Trades. Imagine you borrow interest free money (Yen) to invest in US market. At the beginning, for every 125 Yen you get USD$1. In situation of your investment yields about 10% you shall gain 10% (USD$1.10) because it is interest free. However, in one very fine day, the Yen becomes relatively stronger than before. Let say you converted back USD$1.10 with USD$1 = 110 Yen rate, you receive 121 Yen and you still loss of 4 Yen.
So what is the point? You will not wait the Yen to become stronger before converting it to Yen to avoid unnecessary losses. You will then sell all your investment before the situation turns sour which is unfavored to the market.
Introduction
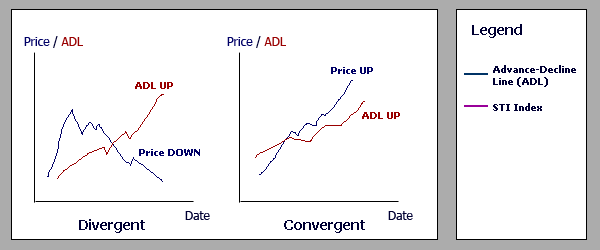
Breadth Line chart is calculated based on the Breadth Line Value (as known as Advance-Decline-Line). Breadth Index is used to measure internal strength of the market. An index may be rising but lacked of internal strength therefore it might gives investor wrong information on the market.How to Use
On days when the number of advancing stocks exceeds the number of declining stocks, the breadth line will rise. On days when more declining stocks than advancing stocks, the line will fall.
When comparing with the price of the stock, a negative divergence trend might suggests signal of weak market. For an example, in some cases of end of bull market, only some large market cap stocks continue to rise. The index will rise due to these stock hence will gives investors an implication that market is still strong. However, this is wrong because the market is not boardly advancing and the risk level increases as divergence continues.
Intraday charts are property of Nikkei Net. For more information please visit Nikkei Net.
Nikkei
USDJPY


