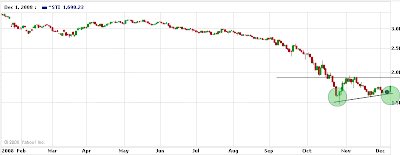
Double Bottom, how true?
Complete Double bottom is formed from two valleys and a breakout of neckline.
Within 10 years STI trend, there are two major uptrends namely (1998 - 2000) and (2003 - 2007). In between these two uptrends, there are few minor uptrend which are (early 1998 - mid 1998), (end 2001 - 2002), (Feb 2008 - June 2008). All of these major and minor uptrend are built from Double Bottom.
How true is this? How long does these uptrend lasted?
Below are few charts extracted from Yahoo. First was the recovery from 1997 market crash. A swift double bottom formed 'V' formation of swift recovery. Second bottom formed 10% above first bottom break out after double bottom.
The recovery doesn't last very long (but strong enough to allow certain group of players regain their capital with 'bankrupt' small chips). The real bottom came after several months later ended with a formation of another double bottom. Second bottom is about 15% above to first bottom.
Then market was hit by 2000 Tech Bubble and it was hit harder when 911 came. However, the recovery from 911 was fast too with Double Bottom. The second bottom is about 7-8% above first bottom.
Real bottom only came after May 2003 when market rallied off the ground until year 2007. The Double Bottom formation is exclusively coupled with inverse H&S formation. Then STI began to mark the starting of Bull market. The second bottom is about the same level as first bottom.
After Oct year 2007 market was beaten down by Subprime (and a lot of stuffs which created from Domino effect. Basically Subprime just some scapegoat of US financial mess). The short recovery was spotted on Feb 2008 when market formed 'Double Bottom'.
The question is should we consider Feb 2008 a double bottom? I will regard it as Double Bottom failed to extend and the period of hanging at the neckline makes me believe it is another distribution stage.
Second bottom off about 3% below first bottom. Surprise to me market would able to rally to June 2008. Basically, this is the time a lot of dressing and distributing is going on.
And now, another round of Double Bottom likely to form. Will STI able to form another double bottom? Or break down? Not until neck line has been breached, we are unsure the formation of major trend.
I see if Double Bottom is formed from this formation, the rally won't last long to become a Bull market. The Double Bottom need to be extended to form better base. Otherwise it would become a short rally like early 1998. Anyway, it is because of early 1998, many of us got back what we have lost on 1997. So, yes or not, depends on you.

