31 March 2008
28 March 2008
27 March 2008
26 March 2008
25 March 2008
24 March 2008
20 March 2008
19 March 2008
14 March 2008
13 March 2008
12 March 2008
11 March 2008
10 March 2008
Valuation Support
First of all, you must be wondering why the market seemed to be recovered after Aug 2007 but the rally does not continue and STI corrects heavily after Oct 2007 until now.
As I always emphasise on ADL (market internal strength) analysis, the ADL must be strong together with STI in order for a rally to continue. If you look at ADL high on July 2007 and compares it to early Oct 2007, the ADL high on Oct 2007 is a higher low. Surprisingly no one believes on what ADL told us on early Oct 2007 when it retreats when STI rallies.
**Refer to this link (forumer slipraven shouts ADL divergent on 9 Oct 2007) . **
Not long after that, I closed all my positions and stayed cautious. From there onwards, I started to trade in short term swing and reduced my holdings. One thing I realised recently, there is a relationship between STI retracement vs ADL retracement. I can't find any related article on this but it is very similar to ccloh's S-theory. You must wondering why all the TA indicators went haywire and you can't believe what you analyse at all. Yes, half true because market gone irrational and screw up the index vs valuation of the market.
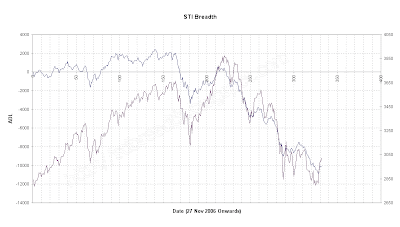
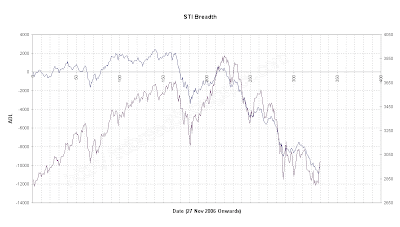
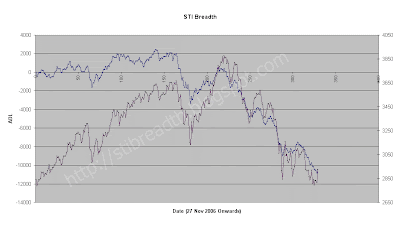
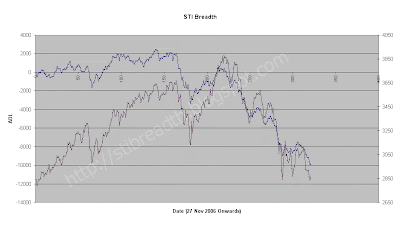
During a market correction (or whatever you call it), the momentum of STI retracement is different from ADL retracement from time to time. Sometimes ADL retraces a lot but STI only retraces a little. Example below:
On 23 Nov 2007, STI retraced 14.2% from the peak and ADL retraced 295% from peak. This creates a "oversold" phenomenon which resulting a strong rebound to 11 Dec 2007 when STI retraced 7.4% and ADL retraced 262%.Why the rebound was denied? It is because it reaches the valuation resistance. In brief, it is a phrase that I came out to describe market pulled up too much until the market is over-valued compared to its internal strength. It is an opposite to 23 Nov 2007 when market is under-valued compared to its internal strength.
In the chart above, there is two valuation resistance because the nature of the market to self-adjust its price and value. After a long time acting irrationally, the market finally readjust itself. The self-adjust does not means STI will rebounds or will be further dipping. The readjustment means market is much stable than previously as its support and resistance is nearer to each other.
There are much to say but it is hard for me to describe the condition. Now, we are still slightly over-value compared with the internal strength. Since we are at between support and resistance, it is not recommended to long or short. Besides, the market internal strength will not forever go down because there must be a value for the companies in STI. I would like to find a final support for STI before go long. Ratio of 0.06 in the chart seemed possible to become strong valuation support when we join all the peak together.
Until then I shall stay cautious and hedge Put when this ratio rebound to valuation resistance.
07 March 2008
06 March 2008
05 March 2008
04 March 2008
03 March 2008
3 Mar 2008
From ccloh's "silly" theory:have you noticed that each time the STI index fall rate is faster than the ADL fall rate, the next moment there will be a technical rebound. look at the 3 sharp dip on the index line from the chart.
Let's call it S-theory, it is more professional this way.
i'm using some "silly" method to judge it. measure the difference distance between the 2 lines. tendency could start a long position there and sell on rebound strength.
"silly" method looks like anything more than 1cm difference between the 2 lines, will change direction next. applies for both directions also.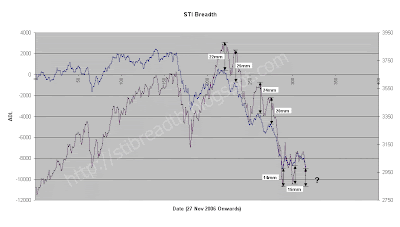
It is simple. If ADL dips together with STI, the 'correction' will be harsher. For example if ADL dips -400 tomorrow and STI dips -80. The rebound will not take place because the difference between ADL and STI is not equal or greater than 15mm.
Let us see whether STI is 'silly' or not.
House Number
| 01 AmFraser 05 UOB KH 08 CS 12 Lim&Tan 17 CIMB-GK 20 Philip 21 KimEng 25 Daiwa 26 BNP 28 OCBC 29 DBSV 31 DMG 35 SBI E2 36 Fortis Clearing | 39 Instinet Singapore 43 OCBC 70 CLSA 71 Nomura 72 Daiwa 73 Macquarie 77 ABN 78 Merrill Lynch 79 JPM 82 MS 83 Citigroup 84 UBS 86 DBSV Online 87 Westcomb |
Donation
Enjoy what you have been reading? You can show your support by donating to the author. In return of your donation, you will be added into the mailing list and will be first updated once a new article is posted on the website.


